In my previous article I described only a very simple part of my monitoring solution for bacula, the focus was on discovering backup jobs and only job exit status was monitored. In this article, I’ll add more monitoring parameters and create some graphs.
Symptoms
The challenge here is that no further job parameters are provided by bacula director when it calls the mail command and thus my wrapper script. To make more job parameters available for monitoring I’ll extend my wrapper script to also look into the bacula underlying database and fetch job statistics from there.
Platform/Tools
No news here, still my server is Ubuntu 14.04.3 LTS, bacula 5.2.6, zabbix 2.2.6. Also, MySQL version is 5.5.44.
Solution
Monitoring individual jobs
Zabbix items
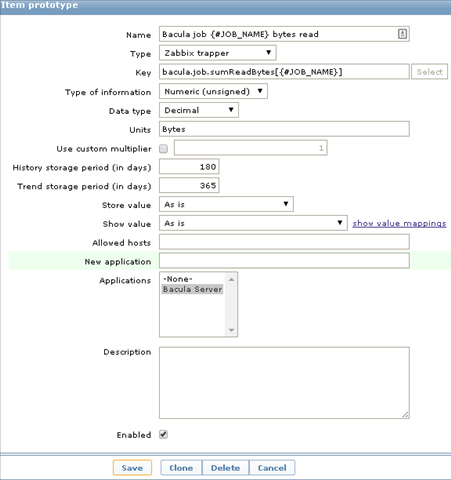
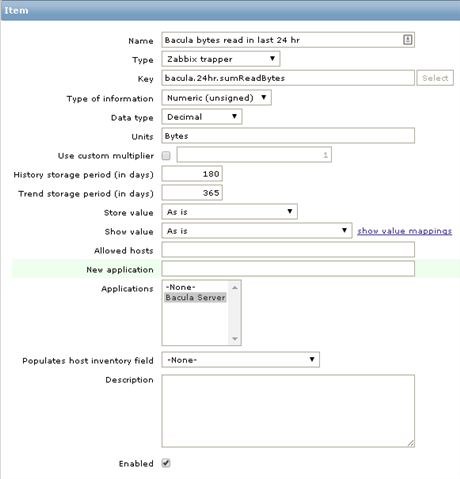
My plan is to monitor the number of files processed by the particular job, the number of bytes read and written. So for each job our zabbix discovery rule will have 3 additional item prototypes. Below I provide only one screenshot, other two are very similar:
Add new items to the wrapper script
The idea is simple, after we send the item reporting job exit status to zabbix, we use job name passed to our script with the option -j to go to the bacula database and fetch some job statistics. This looks a bit clumsy at the first glance, our script will need to know where the database is located and also the user name and the password making our script less portable, but that’s the price.
Here we go :
...
my $MYSQL_SERVER = '127.0.0.1';
my $MYSQL_PORT = '3306';
my $MYSQL_USER = 'bacula';
my $MYSQL_PASSWORD = 'yRacJaj4Eujw';
my $DATABASE = 'bacula';
...
my $JOB_FILES_KEY = 'bacula.job.sumFiles[%s]';
my $JOB_BYTES_KEY = 'bacula.job.sumBytes[%s]';
my $JOB_READ_BYTES_KEY = 'bacula.job.sumReadBytes[%s]';
...
my $dbh = DBI->connect("DBI:mysql:database=$DATABASE;host=$MYSQL_SERVER;port=$MYSQL_PORT",$MYSQL_USER, $MYSQL_PASSWORD,{'RaiseError' => 1});

### Send statistics for individual job
my $sth = $dbh->prepare("SELECT JobFiles,JobBytes,ReadBytes, P.Name AS Pool, if(isnull(sum(`M`.`VolBytes`)),0,sum(`M`.`VolBytes`)) AS `PoolBytes`,P.NumVols FROM Job J, (`Pool` `P` left join `Media` `M` on((`P`.`PoolId` = `M`.`PoolId`))) WHERE J.PoolId = P.PoolId AND J.Job = ?;");
$sth->execute($options{'j'}); #Job name in the form BackupCatalog.2015-02-01_23.10.00_03
my ($jobFiles,$jobBytes,$readBytes,$poolName,$poolBytes,$poolVols) = $sth->fetchrow_array(); #exactly one row expected
$sth->finish();

#Send for the job
system(sprintf($zabbix_sender_cmd_line,sprintf($JOB_FILES_KEY,$options{'n'}),$jobFiles) . " >/dev/null");
system(sprintf($zabbix_sender_cmd_line,sprintf($JOB_BYTES_KEY,$options{'n'}),$jobBytes) . " >/dev/null");
system(sprintf($zabbix_sender_cmd_line,sprintf($JOB_READ_BYTES_KEY,$options{'n'}),$readBytes) . " >/dev/null");
...
$dbh->disconnect();
...
Nothing special here, first we set all variables to access MySQL database, then we specify the item keys that follow the monitoring items we configured in zabbix. Please note that the SELECT statement we use is a bit more complex than expected, this we will need for further extensions.
The last step, we send 3 monitoring items to zabbix.
Adding a trigger
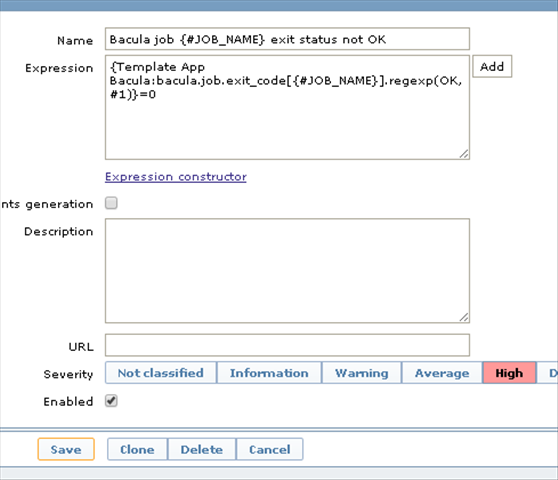
We start with a simple trigger, which will check for the job return status. If it’s not OK – something is wrong:
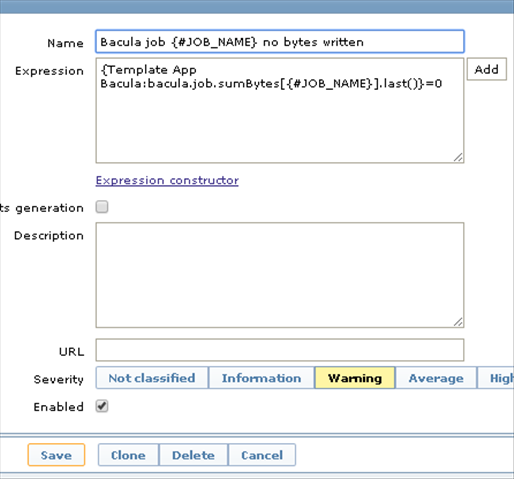
And we add another trigger, this one will check for the number of bytes written, if it is zero – most probably something is wrong. Still there is a small possibility that for example an incremental job has not found any changed files, therefore, if it will be only s Warning:
Adding a graph
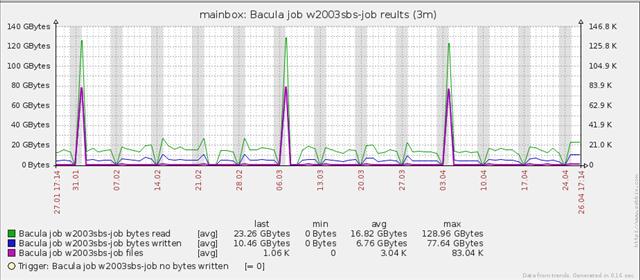
The last step in adding prototypes for a job would be to add a graph with the information about bytes read, bytes written and files processed. Graph configuration is absolutely straightforward, so I would better prove a nice picture after some backup cycles. Below is a 3-month graph for one of the backup jobs.
What about 24-hour statistics?
There is a very nice feature in the webacula tool, I installed very long ago. It shows some aggregated statistics for the last 24 hours. Although we can do some aggregation inside zabbix, I decided to create additional monitoring items and make my wrapper script to also send aggregated statistics.
More zabbix items
Here I made my first mistake, I added aggregated item prototypes to the zabbix Discovery rule. This didn’t work because aggregated items are not bound to individual jobs, while zabbix discovery will try to create new items for every job discovered. So these items shall be created as template items:
Extending script
Same approach as before, we make sure that we use proper keys for our new items and a different SQL command:
...
my $SUM_FILES_KEY = 'bacula.24hr.sumFiles';
my $SUM_BYTES_KEY = 'bacula.24hr.sumBytes';
my $SUM_READ_BYTES_KEY = 'bacula.24hr.sumReadBytes';
...
### Send statstics for the entire installation for the last 24 hr
$sth = $dbh->prepare("SELECT sum(`JobFiles`),sum(`JobBytes`),sum(`ReadBytes`) from `Job` where (`StartTime` > (now() - interval 1 day));");
my ($jobFiles24,$jobBytes24,$readBytes24) = $sth->fetchrow_array(); #exactly one row expected
$sth->finish();

system(sprintf($zabbix_sender_cmd_line,sprintf($SUM_FILES_KEY,$options{'n'}),$jobFiles24) . " >/dev/null");
system(sprintf($zabbix_sender_cmd_line,sprintf($SUM_BYTES_KEY,$options{'n'}),$jobBytes24) . " >/dev/null");
system(sprintf($zabbix_sender_cmd_line,sprintf($SUM_READ_BYTES_KEY,$options{'n'}),$readBytes24) . " >/dev/null");
### Done with the 24-hr
...
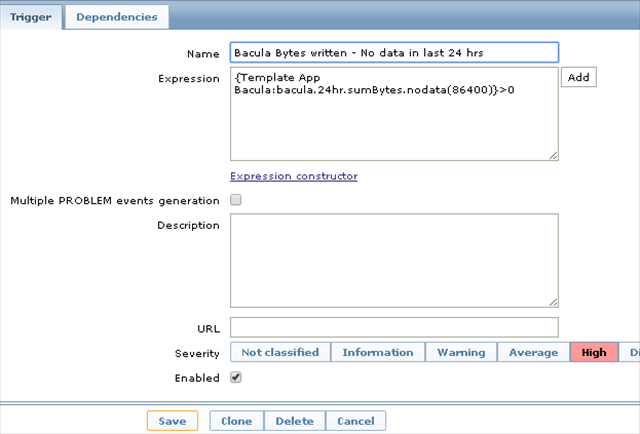
Adding a trigger for 24 hr
While I have my jobs running on different schedules, I expect to backup something every night. So I decided to have a trigger, which will raise an alarm if no backups have run in last 24 hours. In fact, I’m checking for the number of bytes written in last 24 hours and my trigger will fire up if this is zero. Remember, this will be Template trigger and not a Discovery rule trigger prototype:
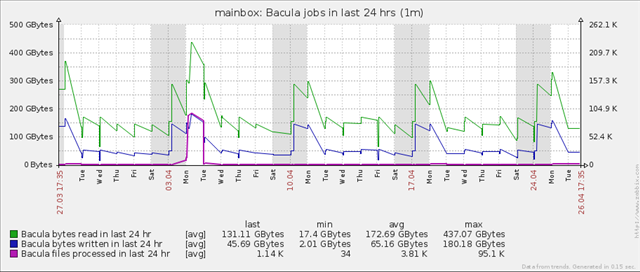
24 hr graph
Having collected information for the last 24 hours we have a very simple job to create a graph to show the number of bytes read, bytes written and files processed. Don’t forget though that this will be not a graph prototype, it will be a template graph. This is because we will have only one graph per host and not per discovered job.
Discussion
Well, graphs could have been sexier, but I leave it to the future articles.
Caveats
None detected so far, but I must admit I’m publishing this article quite some time after I have implemented this solution and I don’t look at these graphs frequently.