
Subject
In this article I explain how to setup Software RAID monitoring with zabbix. The solution will use two ways – active monitoring (polling) of an array status and passive traps for array events, sent out by the mdadm daemon.
Symptoms
Plattform/Tools
Debian GNU/Linux 7.5 (wheezy) and zabbix sever on ubuntu Ubuntu 12.04.4 LTS. Zabbix agent v2.2.3, zabbix server – v2.2.2.Solution
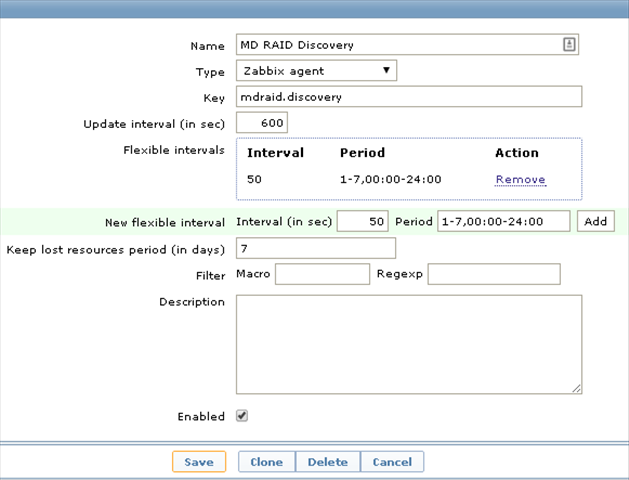
Discovery of md arrays
Create Perl script to support array discovery. I started with shell first, but then switched to my favourite Perl in particular to make sure the script sends properly formatted JSON back to zabbix. So you will need Perl JSON module installed. This looks to be a bit of heavy-weighted, but you wouldn’t want to run discovery every second anyway.
# cat /usr/lib/zabbix/externalscripts/zabbix_mdraid.pl
#!/usr/bin/perl
use strict;
use warnings;
use Getopt::Std;
use JSON;

# declare the perl command line flags/options we want to allow
my %options=();
getopts("D", \%options);
my $arrays_found = undef;
if ($options{D}) {
        open(my $fh, '-|', 'cat /proc/mdstat') or die $!;
        while (my $line = <$fh>) {
                if ($line =~ /^(md\S*)/) {
                        if ($arrays_found) {
                                push(@{$arrays_found->{'data'}},{'{#MD_DEVICE}' => ('/dev/' . $1)});
                        } else {
                                $arrays_found->{'data'}->[0] =  {'{#MD_DEVICE}' => ('/dev/' . $1)};
                        }
                }
        }
}

print encode_json($arrays_found) if ($arrays_found);
Add discovery script to zabbix agent configuration file as a UserParameter:
# cat /etc/zabbix/zabbix_agentd.d/mdraid.conf
...
UserParameter=mdraid.discovery, sudo /usr/lib/zabbix/externalscripts/zabbix_mdraid.pl -D
...
Make sure you gave sudo permissions for the script:
# cat /etc/sudoers.d/zabbix
...
zabbix  ALL=NOPASSWD:   /usr/lib/zabbix/externalscripts/zabbix_mdraid.pl
...
And of course configure the discovery on zabbix server:
Reporting array status
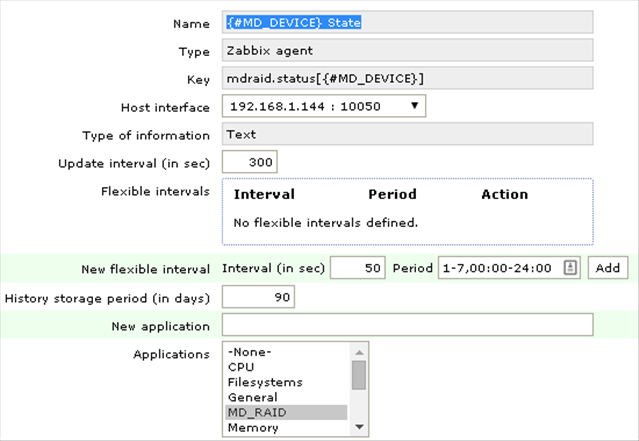
We will extend the above script /usr/lib/zabbix/externalscripts/zabbix_mdraid.pl to also support the check for the array status. It will be run with the command line options -s /dev/mdX to report the status. Now it will look as follows:
#!/usr/bin/perl
use strict;
use warnings;
use Getopt::Std;
use JSON;

# declare the perl command line flags/options we want to allow
my %options=();
getopts("Ds:", \%options);

if ($options{D}) {
	my $arrays_found = undef;
	open(my $fh, '-|', 'cat /proc/mdstat') or die $!;
	while (my $line = <$fh>) {
		if ($line =~ /^(md\S*)/) {
			if ($arrays_found) {
				push(@{$arrays_found->{'data'}},{'{#MD_DEVICE}' => ('/dev/' . $1)});
			} else {
				$arrays_found->{'data'}->[0] =  {'{#MD_DEVICE}' => ('/dev/' . $1)};
			}
		}
	}
	print encode_json($arrays_found) if ($arrays_found);
} elsif ($options{s}) {
	#Will be checking status of a given array
	open(my $fh, '-|', 'mdadm --detail ' . $options{s}) or die $!;
	while (my $line = <$fh> ) {
		if ($line =~ /State\s*:\s*(\S.*)$/) {
			print $1;
			last;
		}
	}
}
We will add it to zabbix agent configuration file as a User Parameter:
...
UserParameter=mdraid.status[*], sudo /usr/lib/zabbix/externalscripts/zabbix_mdraid.pl -s '$1'
...
And configure a zabbix item:
Receiving alerts when array status changes
On my Debian wheezy there is a background process, which monitors the status of md arrays:
~# ps -ef | grep md
root 23 2 0 Jun04 ? 00:00:00 [ksmd]
root 253 2 0 Jun04 ? 00:00:00 [md]
root 260 2 0 Jun04 ? 00:19:53 [md0_raid1]
root 2998 1 0 Jun04 ? 00:00:00 /sbin/mdadm --monitor --pid-file /run/mdadm/monitor.pid --daemonise --scan --syslog
root 10814 12784 0 19:27 pts/1 00:00:00 grep md
This process will use PROGRAM directive from the mdadm.conf file:
~# cat /etc/mdadm/mdadm.conf
# mdadm.conf
#
# Please refer to mdadm.conf(5) for information about this file.
#...

PROGRAM /usr/lib/zabbix/externalscripts/mdadm.pl
...
The program specified by the above directive will be run when mdadm –monitor detects potentially interesting events on any of the arrays that it is monitoring. This program gets run with two or three arguments, they being the Event, the md device, and possibly the related component device.
The mdadm.pl script will send these events to zabbix server in the format similar to mdraid.status.TestMessage[/dev/md0].
# cat /usr/lib/zabbix/externalscripts/mdadm.pl
#!/usr/bin/perl
$ZABBIX_SERVER='192.168.100.8';
$MYHOSTNAME='openfiler';
$SENDER=`which zabbix_sender`;
chomp($SENDER);
$KEY='mdraid.status';

if (!$MYHOSTNAME || !$ZABBIX_SERVER || !$KEY || ! -x $SENDER) {
exit;
}

if ($ARGV[0] =~ /(Rebuild)(\d+)/) {
$ARGV[0] = $1;
$ARGV[2] = $2;
} elsif (!$ARGV[2]) {
$ARGV[2] = 'x';
}

my @result = `$SENDER -z '$ZABBIX_SERVER' -k $KEY."$ARGV[0]"["$ARGV[1]"] -o "$ARGV[2]" -s '$MYHOSTNAME'`;

#print @result;

exit 0;
These events will be received by zabbix items of the type Zabbix trapper. This is described in the next section.
Configuring trappers in zabbix
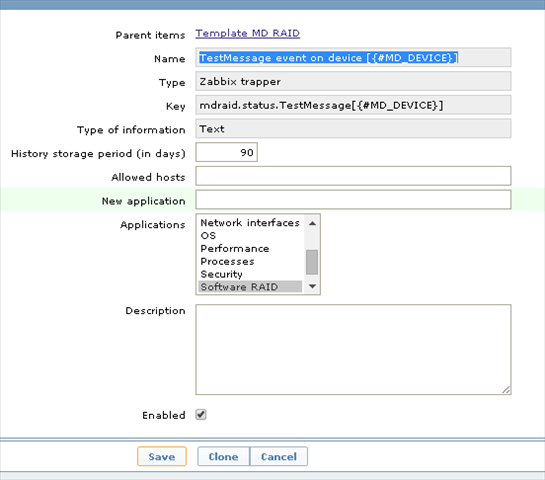
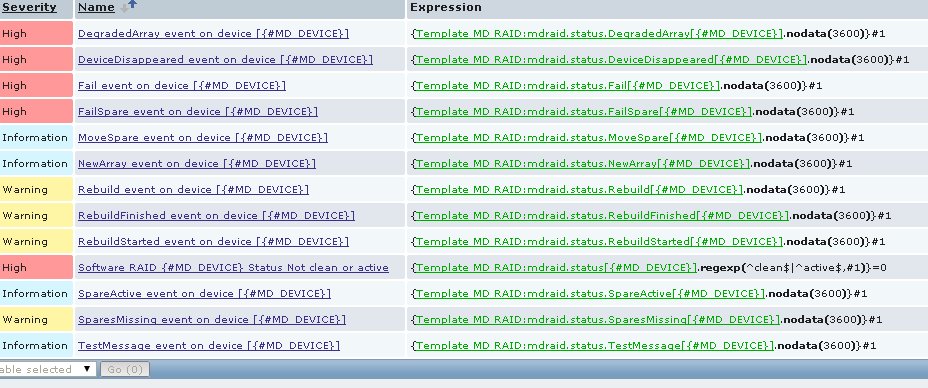
To process mdadm events in a form similar to mdraid.status.TestMessage[/dev/md0] we will create a number of zabbix items of the type Zabbix trapper. An item has to be created for all possible mdadm events.
Here is an example:
When all needed items are created, we will see the following in the list of host items:
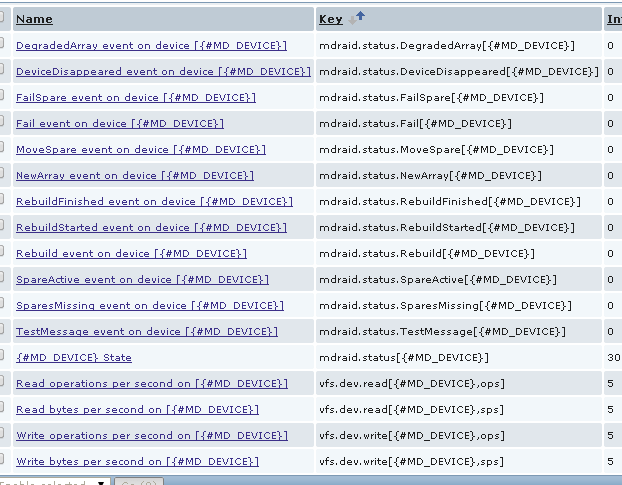
Event names, like TestMessage, DegradedArray, etc. are directly taken from the mdadm man page.
Each trapper item will also have a corresponding trigger with the severity, which again follows the mdadm man page. Here is a list of triggers:
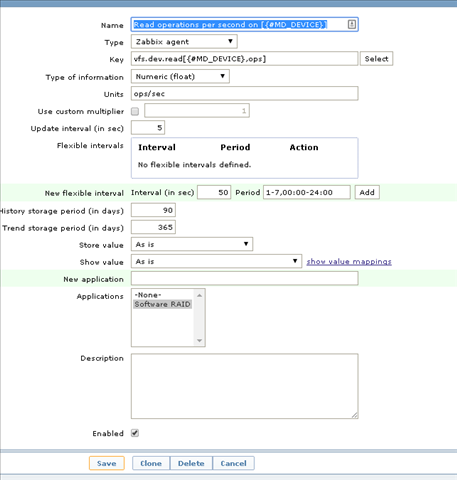
Creating performance counters for RAID devices
This is more a part of discovery and is not specific to RAID devices, so we will create some item prototypes for every discovered RAID device. For simplicity we will use new item types available in zabbix since 2.0. These are vfs.dev.read[<device>,<type>,<mode>] and vfs.dev.write[<device>,<type>,<mode>] .
For example:
Trigger for RAID state change
Just as a last piece in the puzzle, here is one additional trigger to control the array state. If will be using an item created previously, which in turn polls the /proc/mdadm file for the array state. On the assumption that normal array operation will have array state in clean or active, we will be using a regular expression in the trigger condition. By the way, if we put one of the disks to a failed state via mdadm --fail /dev/md0 /dev/sdb1, the array state will show as clean, degraded.
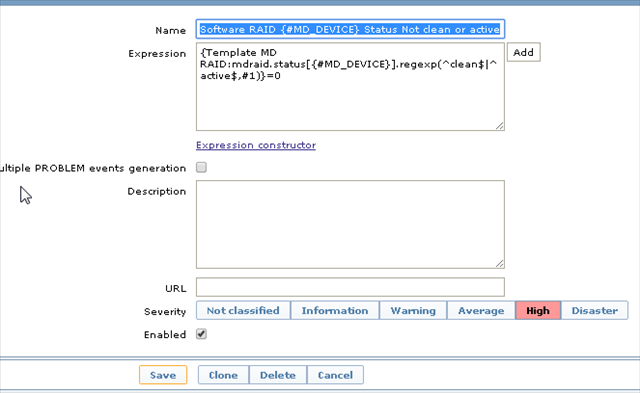
Trigger expressions is as follows: mdraid.status[{#MD_DEVICE}].regexp(^clean$|^active$,#1)}=0.
Transfer to production
- Copy
/usr/lib/zabbix/externalscripts/zabbix_mdraid.plto the RAID host. Make sure JSON.pm is installed. - Copy
/etc/zabbix/zabbix_agentd.confto the RAID host. Restart zabbix agent. - Add lines to
/etc/sudoers.d/zabbix - Update cat
/etc/mdadm/mdadm.confto set PROGRAM - Copy
/usr/lib/zabbix/externalscripts/mdadm.plto the RAID host, update zabbix server IP and the RAID server hostname. - Import the template to zabbix server.